The CCC Intelligence Platform
Everything you run in CCC ONE—rebuilt to load in seconds, comparable across all shops, with alerting built in.
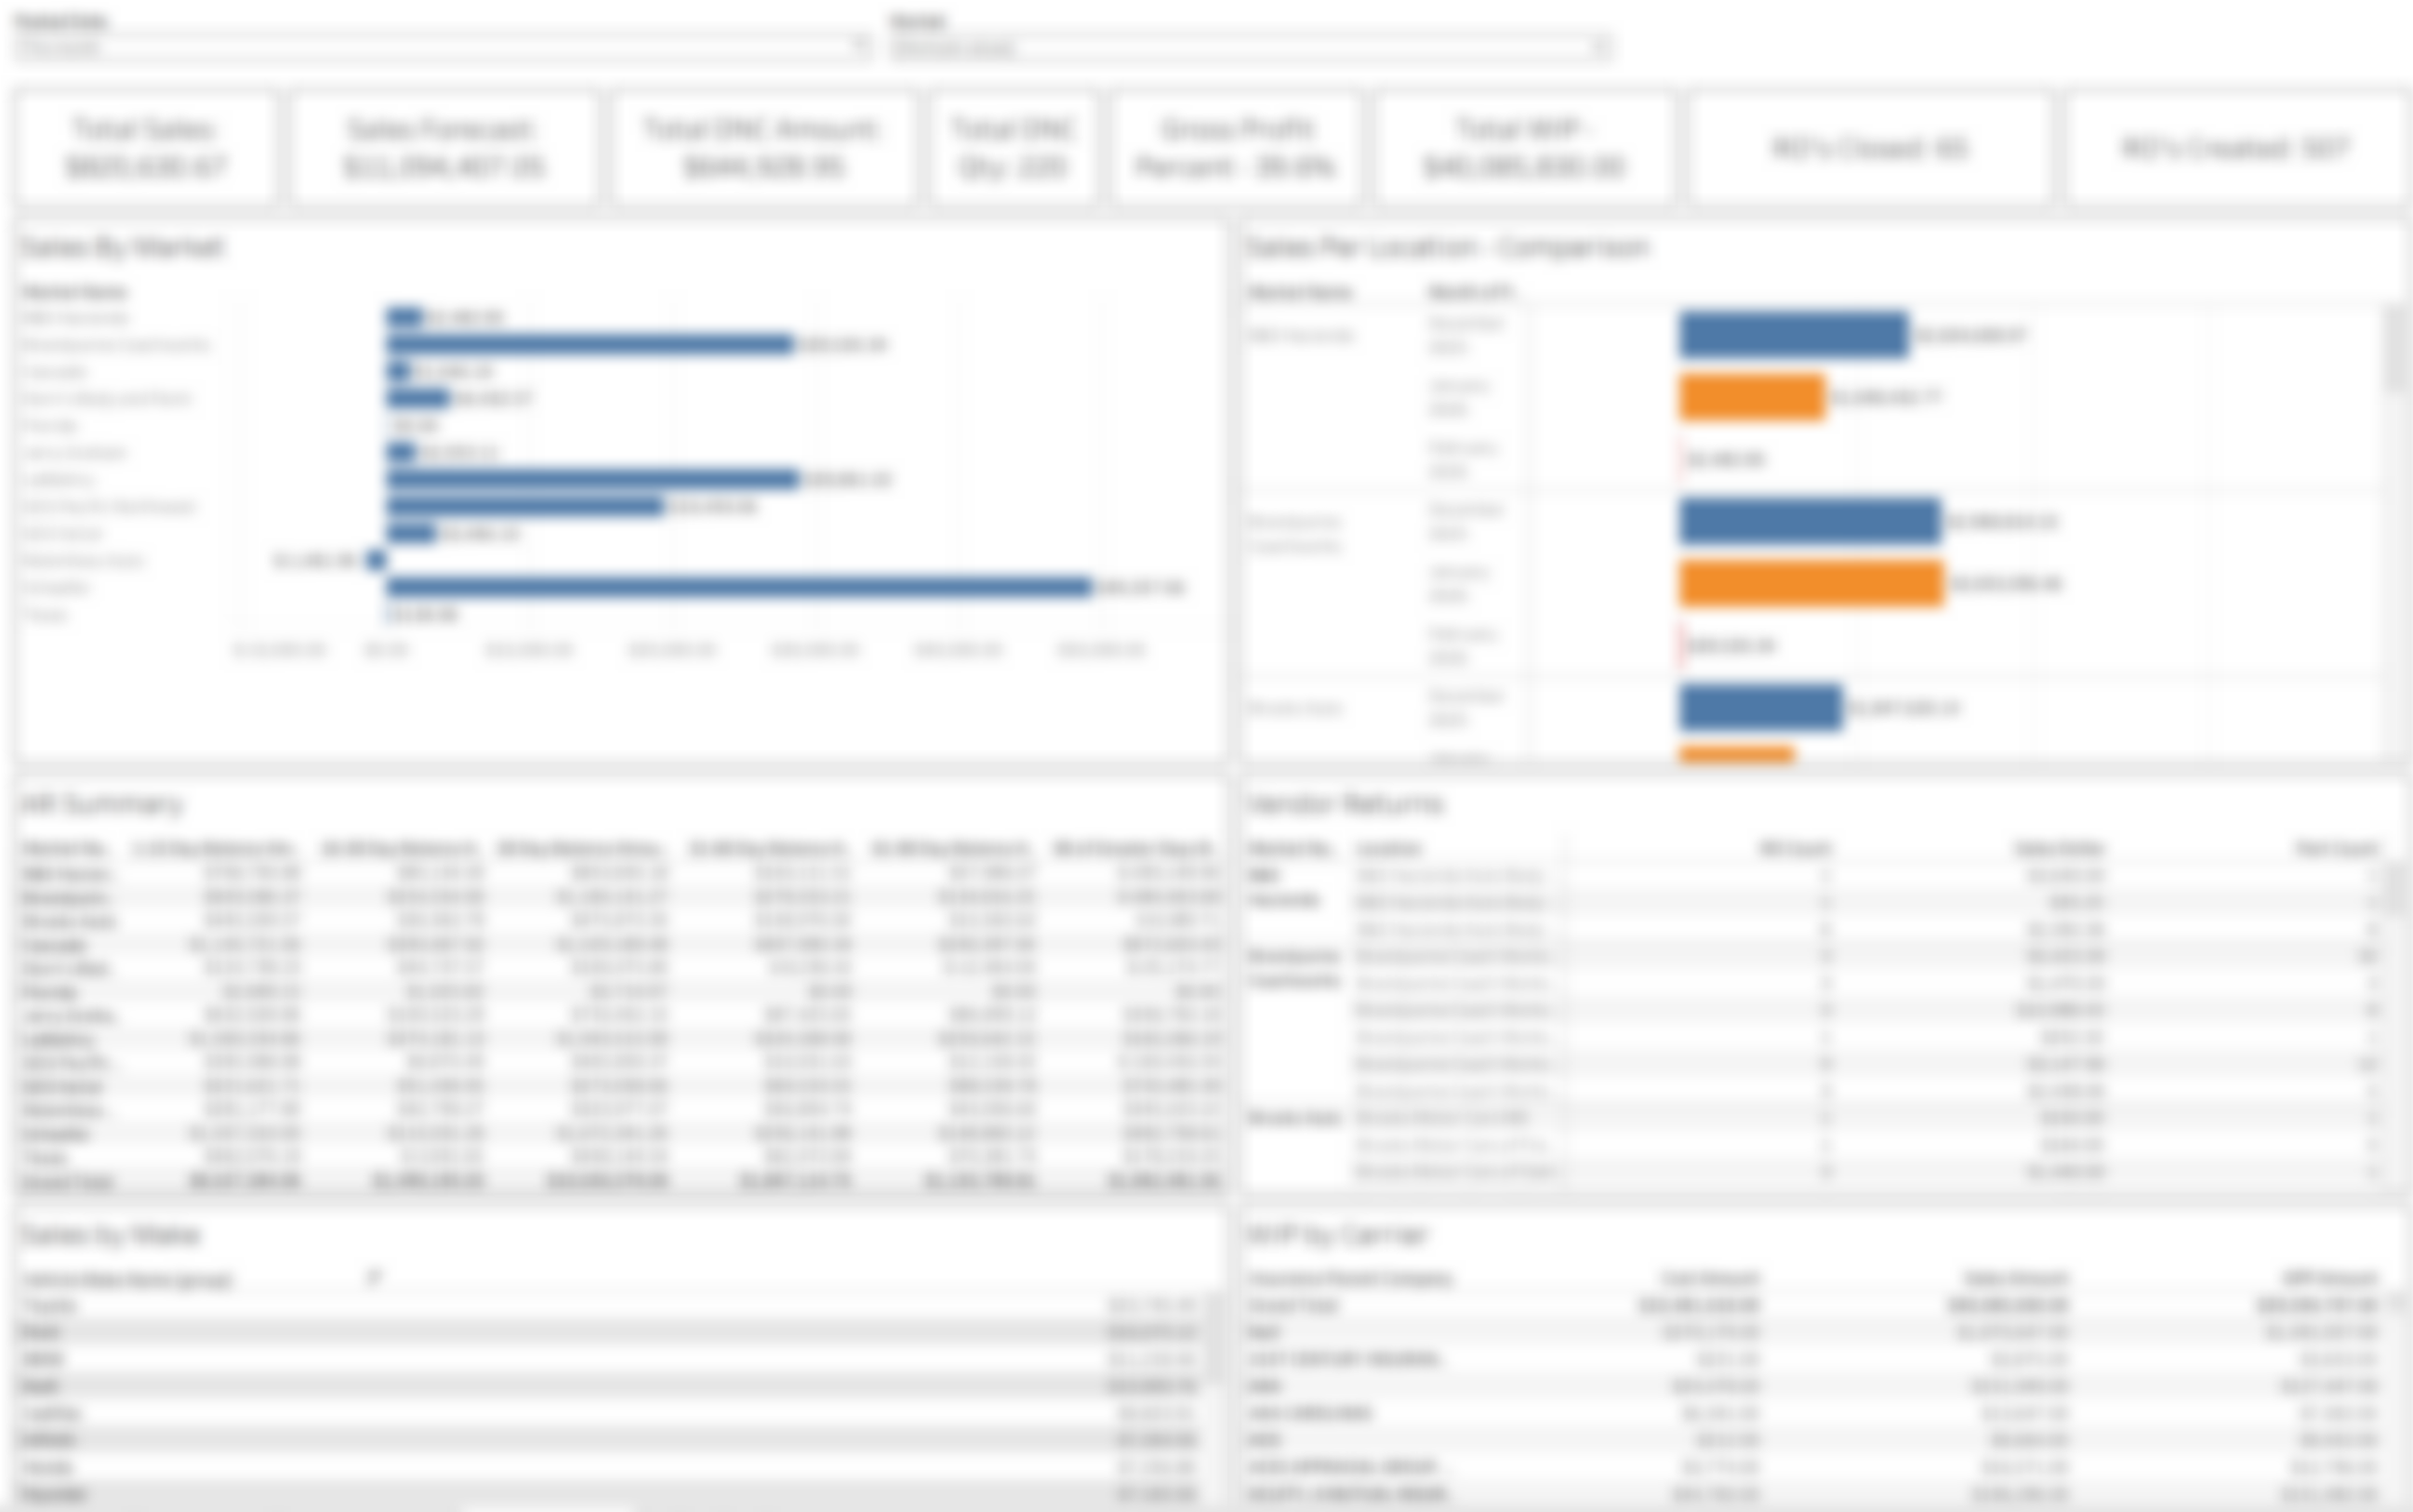
Dashboards Built for MSO Operations
The 30-second health check for leadership. Designed for the conference room TV.
Total WIP count across all shops
Cycle time trends (this week vs. last)
Gross profit vs. target
Sales velocity by market
Red/yellow/green status indicators
Every location ranked on the metrics that matter.
All shops in a sortable table
WIP count, cycle time, GP, sales per shop
Week-over-week and month-over-month trends
Click any shop to drill down
Where your cash is sitting, by shop, by age bucket.
Current WIP count by location
Age distribution: 0-7 days, 8-14, 15-30, 30+
Vehicles delivered but not closed (revenue leakage)
Historical WIP trends for capacity planning
Flagged vehicles aging past threshold
Find the outliers before they become patterns.
Average, median, and P90 cycle time by shop
Distribution charts (not just averages)
Week-over-week trend lines
Outlier ROs flagged automatically
Filter by date range, shop, or market
Find the outliers before they become patterns.
Average, median, and P90 cycle time by shop
Distribution charts (not just averages)
Week-over-week trend lines
Outlier ROs flagged automatically
Filter by date range, shop, or market
Customer satisfaction by location with response rates.
CSI scores by shop
Response rates (are customers actually responding?)
Trend over time
DRP compliance readiness
How the Data Flows
CCC ONE API → Google Cloud Functions → BigQuery → Tableau
↓
Alerting System
Nightly Sync - Every night, we pull your data from CCC's SOAP API. 20+ report types including WIP, Sales Journal, Cycle Time, CSI, Parts Detail, Vehicles Delivered, and more.
Cloud Warehouse - Data lands in Google BigQuery—the same database infrastructure Google uses. Built for fast queries on large datasets. Your all-time queries load in seconds because the data is pre-processed and indexed.
Incremental Updates - For fast-moving data like repair order status, we sync multiple times per day. You're never more than a few hours behind.
Full History - We keep everything. Want to analyze cycle time trends from 2022? It's there. Compare this January to last January? One click.
Know Before It Breaks
The system watches your numbers so you don't have to. Set thresholds, get notified, act before problems spread.
Threshold Alerts
WIP count exceeds X at any shop
Cycle time crosses 10 days (or your target)
Delivered-not-closed count spikes
Gross profit drops below target
Trend Alerts
Cycle time trending up week-over-week
WIP aging faster than normal
CSI declining at a location
System Alerts
Data sync failed (know before the morning meeting)
Data freshness issues
Unexpected data anomalies
Delivery
Alerts via email.
If CCC Has the Report, We Pull It
- Work in Process
- Sales Journal
- Cycle Time RO Completion
- Vehicles Delivered
- Delivered Not Closed
New report integrations available on request. If you need a CCC report we don't currently pull, we'll add it.
- Gross Profit
- Gross Profit for Rebate
- CSI Detail
- Parts Detail
- Parts Purchases
- Labor Hours by Technician
- Captured Jobs Detail
- Captured Jobs Summary
- Supplement Summary
- Payment Summary
- Insurance Carrier Mix
Built for Enterprise
Security:
- CCC credentials stored in Google Secret Manager
- Data encrypted at rest and in transit
- SOC 2 compliant infrastructure (Google Cloud)
- Your data can live in your own GCP project if required
Infrastructure:
- Google Cloud Platform (Functions, BigQuery, Cloud Storage)
- Tableau Cloud for visualization
- 99.9% uptime SLA on Google infrastructure
- Automated monitoring and retry logic
Access:
- Unlimited viewer seats (no per-user fees)
- Role-based access control in Tableau
- SSO integration available